Resources & References
Vehicle Groups Established by FHWA (Section 383.91)
Note: Certain types of vehicles, such as passenger and doubles/triples, will require an endorsement. Please consult text for particulars.
Note: Certain types of vehicles, such as passenger and doubles/triples, will require an endorsement. Please consult text for particulars.
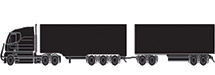
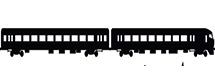
Any Combination of vehicles with a GCWR of 26,001 or more pounds provided the GVWR of the vehicle(s) being towed is in excess of 10,000 pounds.
(Holders of a Group A license may, with any appropriate endorsements, operate all vehicles within groups B and C.)
Examples Include but are not limited to:
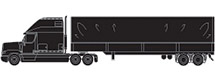
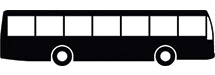
Any single vehicle with a GVWR of 26,001 or more pounds, or any such vehicle towing a vehicle not in excess of 10,000 pounds GVWR. (Holders of a Group B license may, with any appropriate endorsements, operate all vehicles within group C.)
Examples Include but are not limited to:


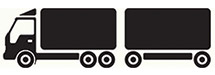
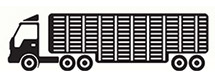
Any single vehicle or combination of vehicles, that does not meet the definition of Group A or Group B as contained herein, but that either is designed to transport 16 or more passengers including the driver, or is placarded for hazardous materials.
Examples Include but are not limited to:


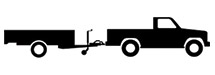
* The representative vehicle for the skills test must meet the written description for that group. The silhouettes typify, but do not fully cover, the types of vehicles falling within each group.
| Year | Fatal | Injury | Property Damage Only | Total | ||||||||||||
|---|---|---|---|---|---|---|---|---|---|---|---|---|---|---|---|---|
| Large Trucks | Buses | Large Trucks and Buses | All Vehicles | Large Trucks | Buses | Large Trucks and Buses | All Vehicles | Large Trucks | Buses | Large Trucks and Buses | All Vehicles | Large Trucks | Buses | Large Trucks and Buses | All Vehicles | |
| 2009 | 2,987 | 221 | 3,197 | 30,797 | 51,000 | 9,000 | 60,000 | 1,517,000 | 232,000 | 47,000 | 278,000 | 3,957,000 | 286,000 | 56,000 | 341,000 | 5,505,000 |
| 2008 | 3,754 | 251 | 3,994 | 34,172 | 64,000 | 11,000 | 74,000 | 1,630,000 | 297,000 | 48,000 | 342,000 | 4,146,000 | 365,000 | 59,000 | 420,000 | 5,810,000 |
| 2007 | 4,204 | 280 | 4,472 | 37,435 | 72,000 | 11,000 | 82,000 | 1,711,000 | 317,000 | 45,000 | 360,000 | 4,275,000 | 393,000 | 56,000 | 446,000 | 6,023,000 |
Notes: A large truck is defined as a truck with gross vehicle weight rating (GVWR) greater than 10,000 pounds. A bus is defined as a motor vehicle designed to carry more than 10 passengers, not including the driver. Numbers for injury and property damage only crashes are estimates based on a GES sample of motor vehicle crashes and are rounded to the nearest thousand.
Source: National Highway Traffic Safety Administration (NHTSA), Fatality Analysis Reporting System (FARS) and General Estimates System (GES).
| Year | Killed | Injured | ||||||
|---|---|---|---|---|---|---|---|---|
| In Large Truck Crashes | In Bus Crashes | In Large Truck and Bus Crashes | In All Vehicle Crashes | In Large Truck Crashes | In Bus Crashes | In Large Truck and Bus Crashes | In All Vehicle Crashes | |
| 2009 | 3,380 | 254 | 3,619 | 33,808 | 74,000 | 20,000 | 93,000 | 2,217,000 |
| 2008 | 4,245 | 311 | 4,545 | 37,423 | 90,000 | 24,000 | 113,000 | 2,346,000 |
| 2007 | 4,822 | 325 | 5,116 | 41,259 | 101,000 | 24,000 | 124,000 | 2,491,000 |
Source: NHTSA, FARS and GES.
| Year | Fatality Rates | Injury Rates | ||
|---|---|---|---|---|
| Large Trucks and Buses | All Vehicles | Large Trucks and Buses | All Vehicles | |
| 2009 | 0.123 | 1.14 | 3.15 | 75.1 |
| 2008 | 0.153 | 1.26 | 3.81 | 78.8 |
| 2007 | 0.169 | 1.36 | 4.09 | 82.2 |
Note: Large truck and bus fatality and injury rates are calculated on the basis of total vehicle miles traveled by all vehicles as a measure of overall highway safety.
Sources: Federal Highway Administration (FHWA), Highway Statistics 2009, Table VM-1; NHTSA, FARS and GES
| Year | Fatal Crashes | Injury Crashes | Property Damage Only Crashes | Total: All CMV Crashes |
|---|---|---|---|---|
| 2009 | $23 Billion | $20 Billion | $5 Billion | $48 Billion |
| 2008 | $29 Billion | $25 Billion | $6 Billion | $60 Billion |
| 2007 | $32 Billion | $27 Billion | $6 Billion | $65 Billion |
Source: T. Miller, E. Zaloshnja, and R. Spicer, Revised Cost of Large Truck and Bus Involved Crashes (2006), adjusted to 2008 dollars and 2008 value of a statistical life (VSL).
| Year | Registered Vehicles | Million Vehicle Miles Traveled | ||||
|---|---|---|---|---|---|---|
| All Vehicles | Large Trucks | Buses | All Vehicles | Large Trucks | Buses | |
| 2009 | 254,212,610 | 10,973,214 | 841,993 | 2,953,501 | 288,005 | 14,358 |
| 2008 | 255,917,664 | 10,873,275 | 843,308 | 2,976,528 | 310,680 | 14,823 |
| 2007 | 254,403,081 | 10,752,019 | 834,436 | 3,031,124 | 304,178 | 14,516 |
Source: FHWA, Highway Statistics 2009, Table VM-1.
| Year | Interstate Freight | Interstate Passenger | Intrastate Hazardous Material |
|---|---|---|---|
| 2010 | 512,180 | 13,782 | 14,127 |
| 2009 | 502,988 | 13,317 | 12,830 |
| 2008 | * | * | * |
Note: Company counts are estimates based on motor carriers in MCMIS with recent activity, defined as those carriers that have had an inspection, a crash, a compliance review, a safety audit, an FMCSA Motor Carrier Identification Report (Form MCS150) update, a vehicle registration activity, or a Unified Carrier Registration (UCR) system payment activity in the past 3 years, or have current operating authority indicated in the Licensing and Insurance (L&I) database.
*Data not available.
Source: Federal Motor Carrier Safety Administration (FMCSA), Motor Carrier Management Information System (MCMIS), Snapshots as of December 19, 2008, December 18, 2009, and December 17, 2010.
| Year | Interstate Freight | Interstate Passenger | Intrastate Hazardous Material |
|---|---|---|---|
| 2010 | 512,180 | 13,782 | 14,127 |
| 2009 | 502,988 | 13,317 | 12,830 |
| 2008 | 5,113 | 846 | 20,057 |
Note: A broker is an individual, partnership, or corporation that receives payment for arranging the transportation of property or household goods belonging to others by using an authorized motor carrier.
Source: FMCSA, MCMIS and Licensing and Insurance (L&I) database, snapshots as of December 19, 2008, December 18, 2009, and December 17, 2010.
| Year | All CMV Drivers | Interstate CDL Drivers | Interstate Non-CDL Drivers | Intrastate CDL Drivers | Intrastate Non-CDL Drivers |
|---|---|---|---|---|---|
| 2010 | 5,600,000 | 2,800,000 | 600,000 | 900,000 | 1,300,000 |
Note: Driver counts are estimates based on motor carriers in MCMIS with recent activity, and extrapolation from States requiring intrastate carriers to obtain DOT numbers to estimate all intrastate driver
counts. Intrastate drivers include drivers that work for interstate motor carriers. CDL = commercial driver’s license.
Source: FMCSA, MCMIS, Snapshot as of March 25, 2011.
| Year | Driver Inspections | Driver OOS Rates | Vehicle Inspections | Vehicle OOS Rates | ||||
|---|---|---|---|---|---|---|---|---|
| Large Trucks | Buses | Large Trucks | Buses | Large Trucks | Buses | |||
| 2010 | 3,455,542 | 44,566 | 5.2% | 4.9% | 2,349,100 | 84,554 | 20.3% | 6.5% |
| 2009 | 3,405,760 | 51,069 | 5.6% | 4.3% | 2,286,260 | 77,740 | 21.7% | 7.5% |
| 2008 | 3,292,069 | 51,015 | 6.4% | 4.4% | 2,258,988 | 130,946 | 23.1% | 7.5% |
Source: FHWA, Highway Statistics 2009, Table VM-1.
| Year | Total Motor Carriers in the New Entrant Program | Carriers Entered During the Year | Safety Audits |
|---|---|---|---|
| 2010 | 100,023 | 75,933 | 32,757 |
| 2009 | 83,111 | 72,515 | 36,779 |
| 2008 | 80,563 | 63,812 | 38,831 |
Note: A new entrant is a motor carrier that applies for a U.S. DOT identification number in order to initiate operations in interstate commerce or the intrastate transportation of hazardous materials.
Source: FMCSA, MCMIS, Snapshots as of December 19, 2008, December 18, 2009, and December 17, 2010.